What is a good engagement rate? Average engagement rates by platform (2026)
Published averages range from under 0.1% to over 10%, and most of that gap comes from who and what is being measured. Here are the real numbers, and how to compare yourself fairly.

"What's a good engagement rate?" is one of the most searched questions in social media marketing, and one of the most confusing to answer, because published averages range from a few hundredths of a percent to more than 10%. Most of that spread isn't about performance at all. It comes from three choices every benchmark makes: whose accounts it measures, what it divides by, and when the data was collected. This guide gathers the most recent published figures, explains why they differ, and shows how to judge your own rate fairly.
Brands and creators have different normals
The best-known benchmark reports measure brand accounts: companies posting about their own products. Creators, whose audiences follow them as people, engage at several times the rate. On Instagram, by followers:
| Source | Accounts | Instagram rate |
|---|---|---|
| Rival IQ 2026 report (2025 data) | Brands, median per post | 0.30% |
| Socialinsider (2025 data) | Brands with 1K–1M followers, average | 0.48% |
| HypeAuditor (2024 data) | Influencers, average | 1.59% |
If you're a creator and compare yourself with a brand benchmark, you'll look like a star. If a brand compares its own channel with creator averages, it will look like a failure. Neither comparison is useful.
Brand benchmarks by platform
Rival IQ, now published by Quid, calculates engagement per post as total interactions divided by follower count, across 150 randomly chosen companies in each of 18 industries. Its 2026 report (covering 2025) gives these all-industry medians:
| Platform | 2026 report (2025 data) | 2025 report (2024 data) |
|---|---|---|
| TikTok | 2.01% | 1.73% |
| 0.30% | 0.36% | |
| YouTube | 0.21% | not reported |
| X (Twitter) | 0.03% | 0.015% |
Socialinsider's 2026 benchmarks, also from brand accounts with 1,000 to 1 million followers, tell the same story with somewhat higher averages: TikTok 3.70% and Instagram 0.48% by followers for 2025. Socialinsider's own TikTok page reports engagement by views at about 3.9% in 2026. TikTok consistently leads because its feed shows posts to people who don't follow the account, so interactions are high relative to follower count.
LinkedIn is usually measured differently. Socialinsider calculates it as reactions, comments and shares divided by impressions, and reports an average of 5.20% for brand pages. By format, document posts led at 7.00%, followed by multi-image posts (6.45%) and video (6.00%), with link posts lowest at 3.25%. Because the denominator is impressions, these numbers can't be compared with follower-based rates on other platforms.
Account size changes everything
Engagement rate generally falls as accounts grow: early followers tend to be the most interested, and later ones arrive through viral moments and are more casual. Reliable, recent creator figures by size are scarce. HypeAuditor reports that nano-influencers on TikTok (under 10,000 followers) see an average engagement rate of 10.3%, far above any brand benchmark. Socialinsider's TikTok data for brand accounts shows the same direction, though on its view-based measure the spread is narrow:
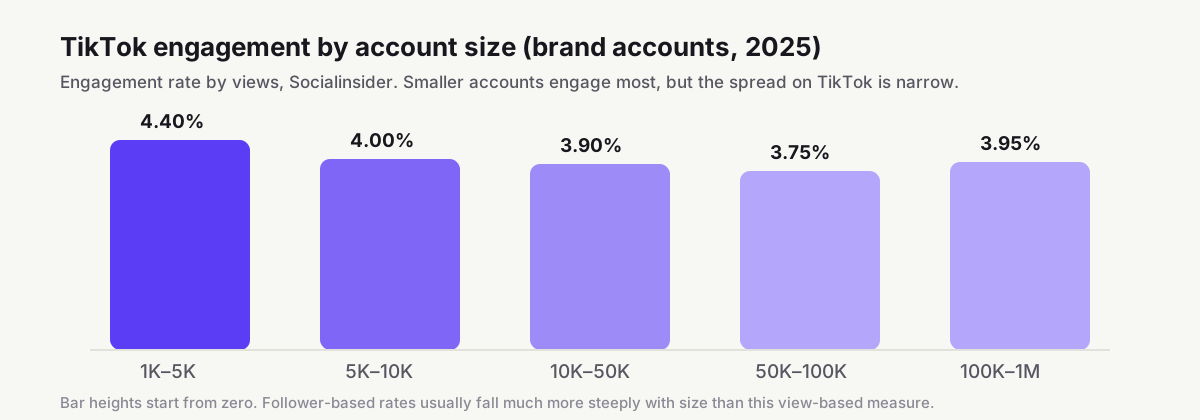
This is why DigitalKari's engagement rate calculator compares you only with accounts of a similar size. Its bands are working ranges for creator accounts. On Instagram, for example, it treats about 2.0%–4.5% as average under 10,000 followers and 0.6%–1.6% above a million. They sit well above brand benchmarks, in line with the creator figures above.
Why the same account gets different rates
| Method | Divides by | Typical use |
|---|---|---|
| By followers | Follower count | Comparing accounts publicly; most brand benchmarks |
| By reach | Unique accounts that saw the post | Judging individual posts from your own analytics |
| By views | Plays or displays | TikTok, Reels and video |
| By impressions | Times content was displayed | LinkedIn and paid campaigns |
Even the numerator varies: Socialinsider counts likes and comments for Instagram but likes, comments, shares and saves for TikTok. Before you compare yourself with any figure, check what it divides by and what it counts. Our guide to engagement rate formulas walks through each with a worked example.
When a rate is too good
A very high rate on a large account deserves a second look. It may be one viral post inflating a small sample, or it may be bought engagement. Instagram's Community Guidelines ask users not to artificially collect likes, followers or shares, and not to offer money or giveaways in exchange for engagement. In the United States, the FTC's rule on fake reviews and testimonials, in force since October 2024, prohibits buying or selling fake indicators of social media influence, such as followers or views generated by bots or hijacked accounts. Brands increasingly check for this: in Influencer Marketing Hub's 2026 survey, fake or bot followers accounted for 56.5% of all reported fraud and quality issues.
How to use benchmarks well
- Pick the right population. Creators should compare with creators of a similar size; brands with brands in their industry.
- Match the formula. Compare follower-based with follower-based, view-based with view-based.
- Average 10 to 12 recent posts. Single posts swing wildly.
- Track your own trend. Your rate this quarter against last quarter is more useful than any industry average.
- Use it in pitches carefully. Quote your rate with the method and period, so brands can check it. See the media kit guide.
Frequently asked questions
What is a good engagement rate on Instagram?
It depends who you compare with. Brand accounts had a median of 0.30% by followers in Rival IQ's 2026 report, while HypeAuditor reported an average of 1.59% for influencers in 2024. For creators, compare yourself with accounts of a similar size; DigitalKari's calculator treats roughly 1.3% to 3% as average for 10,000 to 100,000 followers.
What is a good engagement rate on TikTok?
TikTok rates are higher than Instagram's. Rival IQ reported a 2.01% median by followers for brand accounts in its 2026 report, Socialinsider reports around 3.9% by views for brands, and HypeAuditor reported 10.3% on average for nano-influencers under 10,000 followers.
Why do different reports give different engagement rates?
They divide by different things (followers, reach, views or impressions), measure different accounts (brands or creators), and use different samples and years. A rate is only comparable with another rate calculated the same way.
Is a higher engagement rate always better?
Usually, but an unusually high rate on a large account can be a red flag for bought engagement or a single viral post. Brands check averages across recent posts, and in the US the FTC's rule bans buying fake indicators of social media influence such as bot followers or views.
How do I calculate my own engagement rate?
Add your average likes, comments and shares or saves per post, divide by followers and multiply by 100. The DigitalKari engagement rate calculator does this and compares the result with accounts of your size.
Benchmark figures reflect the reports below as reviewed on 29 October 2026. Reports differ in samples and methods; see each source for details.
References
- 2026 Social Media Industry Benchmark ReportQuid (Rival IQ), 5 March 2026
- 2025 Social Media Industry Benchmark Report (PDF)Rival IQ
- Social Media Benchmarks for 2026Socialinsider
- 2026 TikTok BenchmarksSocialinsider
- LinkedIn Organic Benchmarks 2026Socialinsider
- 2025 Influencer Marketing Trends and InsightsHypeAuditor
- Influencer Marketing Benchmark Report 2026Influencer Marketing Hub, 4 May 2026
- FTC announces final rule banning fake reviews and testimonialsUS Federal Trade Commission, 14 August 2024
- Community GuidelinesInstagram Help Center
We link to primary sources where possible. Rules and figures change; check the source for the current version.