YouTube CPM by country: why the same views pay so differently
Where your viewers live can change your ad income several-fold. YouTube says so plainly; here is why it happens, how to check your own split, and what you can realistically do about it.

Two YouTubers each get 100,000 views a month. One earns several hundred dollars, the other a fraction of that, and their videos are similar. Very often the difference is where their viewers are. YouTube's own help pages say it directly: different locations have different levels of competition in the ad market, so CPMs vary by geography. This guide explains why, shows how to check your own audience, and sets out what you can do about it.
First, CPM vs RPM
YouTube defines CPM as the cost per 1,000 ad impressions before YouTube's revenue share. It's what advertisers pay. RPM is how much money you've earned per 1,000 video views, after YouTube's share and across all revenue sources. Location affects both: advertisers pay different CPMs to reach different countries, and that flows through to your RPM.
Why advertisers pay more in some countries
Ads on YouTube are sold through auctions. Google's Ad Rank documentation lists the bid as one of the factors that decide which ad wins. YouTube's help page adds that advertisers can choose which geographies they want to reach. Put those together: in markets where many advertisers want to reach viewers, and where each customer is worth more to them, bids are higher and so are CPMs.
A big driver of "worth more" is spending power. The World Bank's data shows how wide the gap is:
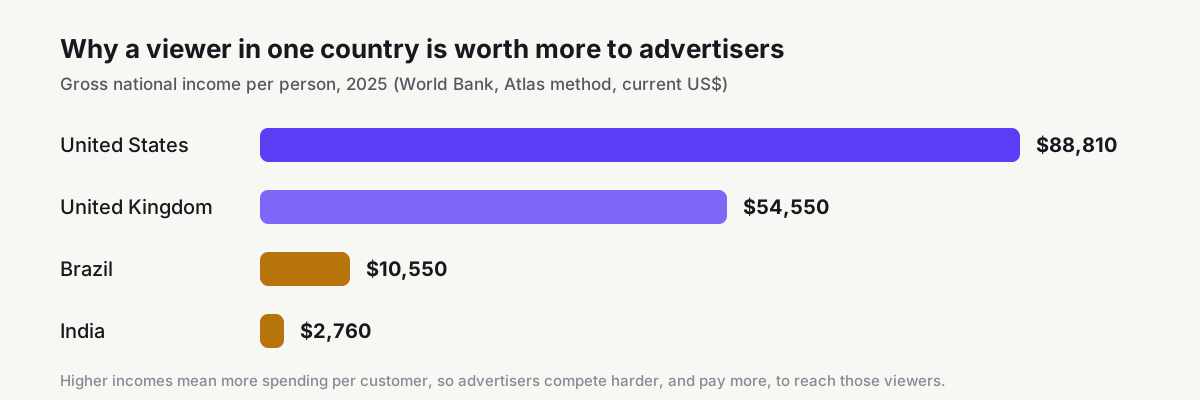
Higher incomes mean higher average purchases, so an advertiser can justify paying more for each viewer. That doesn't make lower-income markets worthless. Fast-growing markets attract plenty of advertisers, and local brands compete for local viewers. But the global pattern is consistent: ad prices broadly follow purchasing power and advertiser competition.
What it means for your income
YouTube doesn't publish CPM or RPM by country, and the country tables circulating online come from third parties with different methods. Rather than repeat one, here is how our ad revenue calculator models audience location for a long-form lifestyle channel:
| Main audience | Location factor | Estimated RPM | 100,000 views / month |
|---|---|---|---|
| Mostly US, UK, Canada, Australia | 1.0× | $4.75–$10.45 | $475–$1,045 |
| Mixed (about half of the above) | 0.55× | $2.61–$5.75 | $261–$575 |
| Mostly emerging markets | 0.22× | $1.04–$2.30 | $105–$230 |
Shorts are affected too. YouTube shares the Shorts Creator Pool by each creator's share of engaged views in each country, so where your Shorts viewers are also shapes what you earn from them, even though the overall per-view amounts are much smaller than long-form.
How to check your own audience geography
You don't need to guess. In YouTube Studio's Analytics, Advanced mode lets you break reports down by geography and filter by country, and revenue is one of the available metric groups. That means you can see which countries generate your views and which generate your revenue. They're often very different lists.
Two caveats from YouTube's documentation. Geography data for some metrics can be limited, although YouTube says revenue data by geography is not limited. And realtime reports and private or unlisted videos don't show geography data at all, so judge on public videos over at least 28 days.
Where you can join the Partner Program
Ad revenue also depends on where you are. YouTube publishes a list of countries and regions where creators can join the YouTube Partner Program; India, Brazil, the United States and the United Kingdom are among them, and since March 2022 creators in Russia can't complete new sign-ups. Check the list for your country before planning around ad income.
Common misconceptions
- "YouTube pays different rates in different countries." Not exactly. Creators get the same 55% share of long-form ad revenue everywhere; what differs is how much advertisers pay to reach viewers in each market.
- "Using a VPN or moving changes my RPM." Ad prices follow where your viewers are, not where you upload from. Your own location matters for Partner Program eligibility and tax, not for the CPM your viewers attract.
- "A country table online tells me my RPM." Third-party tables mix channels, niches and years. Your Studio revenue broken down by geography is the only figure that applies to you.
- "Lower-CPM audiences aren't worth having." Views from every country count toward Partner Program thresholds, build your audience and can attract sponsors who sell in those markets.
How to earn more from geography
- Make content for the audience you want. Topics, references, prices and examples that matter to viewers in higher-spending markets attract those viewers. A budgeting video in US dollars reaches a different audience from one in rupees.
- Add subtitles and translated titles. They open your videos to viewers in more countries without changing the content.
- Don't chase geography at the expense of your audience. A loyal audience in a lower-CPM market can still be a strong business through sponsorships from brands that sell there. Use the sponsored post rate calculator to compare.
- Watch the season as well. YouTube notes that advertisers bid higher or lower depending on the time of year. See why YouTube pays more in Q4.
- Combine with niche. Location and topic multiply together, so a finance video for a US audience sits at the top of both scales. See the highest-paying niches.
YouTube details reflect its help pages as reviewed on 29 October 2026. World Bank figures are 2025 values accessed in October 2026 and may be revised.
References
- Understand ad revenue analyticsYouTube Help
- Learn how to use Advanced mode for analytics reportsYouTube Help
- Understand limited data in YouTube AnalyticsYouTube Help
- YouTube Shorts monetization policiesYouTube Help
- YouTube Partner Program availabilityYouTube Help
- GNI per capita, Atlas method (current US$)World Bank Open Data
- About Ad RankGoogle Ads Help
We link to primary sources where possible. Rules and figures change; check the source for the current version.